NFS Success Story Series: how we help… Kennedys
Read more
NFS Technology is a representative vendor in the Market Guide for Workplace Experience Applications 2023.
Read client reviews of the technologyTrusted by businesses globally
1675+
Successful projects
1800+
Happy clients
40+
Countries
80+
Expert staff globally


Experience the great workplace reset

Connected people and places

A great digital employee experience

Optimized space utilization
Resetting the future of the workplace

The evolving workplace
As hybrid working develops, the workplace is continuing to evolve, fast. Leaders need to respond to changing demands of staff and the organization, and use data to ensure good space utilization
Read more
Embracing the technology
Workspace management technology provides the toolkit for leaders and managers to create optimum working environments that encourage collaboration, teambuilding, wellness and positive work outputs
Read more
Employee experience
The most successful workplaces are now people centric spaces where staff are free to enjoy the best employee experience, and can feel happy and fulfilled in their work, driving up talent retention and wellness
Read moreRendezvous
Your perfect partner for workplace management
Employee experience
Rendezvous removes obstacles to effortless working and helps you make the office the place to be, by creating a great employee experience every day
Read moreMeeting room booking
Organize meetings and book rooms and equipment in minutes, via an app that informs everyone of any changes
Read moreDesk booking
Find and book your desk easily, via a desk booking software app with a graphical floor plan that also helps you locate colleagues
Read moreSpace utilization
Track how your space is really being used, in real time, and capture data to support good real estate planning
Read moreManaging services
Streamline catering and AV requests, make it easy for staff to order on the app and manage issues easily with the service tracker
Read moreVisitor experience
Treat visitors like VIPs every time with touch-free check in, data capture and wayfinding signage to get them to their meeting
Read moreCase Studies
Discover our NFS success stories – learn how
Rendezvous is helping leading organizations from many industry sectors across the world
Why choose NFS to enable your big workplace reset?
Expertise
Expertise
The worldwide NFS team has years of experience in the successful support of organizations across a wide range of industry sectors
Trusted partner
Trusted partner
With continual development our watchword, we are trusted globally to provide the most up-to-date, effective advice and practical help
Consultative approach
Consultative approach
Our experts pride themselves in working with you to understand your business and providing the solutions that satisfy your needs
Integration friendly
Integration friendly
With its Open API, Rendezvous integrates seamlessly with the other technologies that support your hybrid workforce, including sensors, digital signage and panels
Long relationships
Long relationships
We build long-lasting relationships with our clients – a high proportion have been with us for more than 10 years
24/7 live support
24/7 live support
With NFS, you are never on your own – our global helpdesk is staffed by experts every hour of every day if you need help
Your ultimate guides to success in the great workplace reset
The evolving workplace
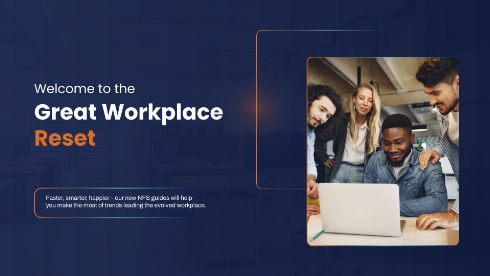
What changes do you need to respond to now and in the future? This guide explains
DownloadDigital democracy
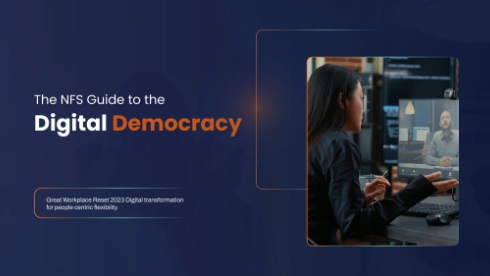
How can you make sure your entire workforce gets the benefit of technology? Check this out
DownloadPeople centric workplace
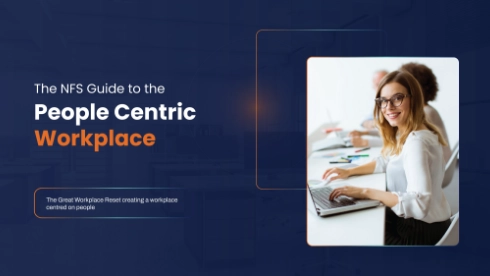
How to use technology to put people at the heart of your workplace strategy – and retain talent
DownloadReset world of work
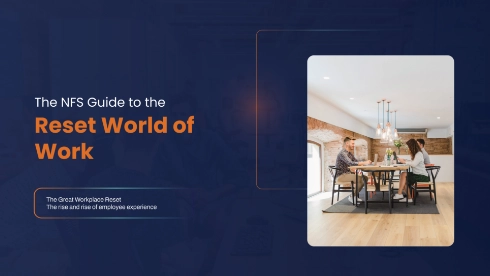
If you want insights into improving the employee experience then download the guide today.
DownloadNew values of real estate

Discover how to get the most out of your real estate and download the guide today.
DownloadTools for digital dexterity
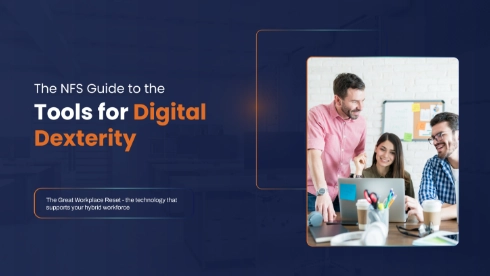
If you want to make your workplace a success then download the guide today.
DownloadWhat our
customers say
Trusted by 1800+ partners & customers
Gartner
4.9 / 5 -from the Verified Reviews

Capterra
4.9 / 5 -from the Verified Reviews
Client success stories
We needed a room booking system that was easy to use, could get the job done quickly and be transparent enough so that all staff can see which rooms are available, and when.
Terry Murphy
Assistant Director of Property, Epsom and St Helier NHS Trust

This new technology has increased our productivity at DLA Piper. NFS Rendezvous software is simple to use — once we got it set up it was easy to book meetings.
Kevin Wertlieb
Senior Unified Communications Engineer, DLA Piper
Once Rendezvous was installed, it was surprisingly easy to use – especially for a mature non-techie like me. We’ve cut phone calls by a third, which means much more time for quality service for staff and visiting clients.
Caroline Kennedy
Reception manager
Explore our latest resources
What can Rendezvous do for me?
This video highlights the top questions people ask us about our Rendezvous workspace management software, and sums up the fantastic...
Watch video
What, why and how to collaborate
Discover how technology holds the key to helping your workers find and book space, locate colleagues and get down to the serious...
Watch video
Space utilization guide
With the hybrid workplace now a reality, the Ultimate Guide to Space Utilization by NFS is designed to show leaders how to capture...
Download brochure
International law firm supports hybrid working
How a top international law firm uses Rendezvous to support its hybrid working staff, enhance space utilization...
Read moreSpeak to an NFS expert now!
Please fill up the form below and one of our representatives will contact you shortly.